USDOLLAR Pullback At Key Fib Levels on Hourly
Dow Jones FXCM Dollar Index FX:USDOLLAR

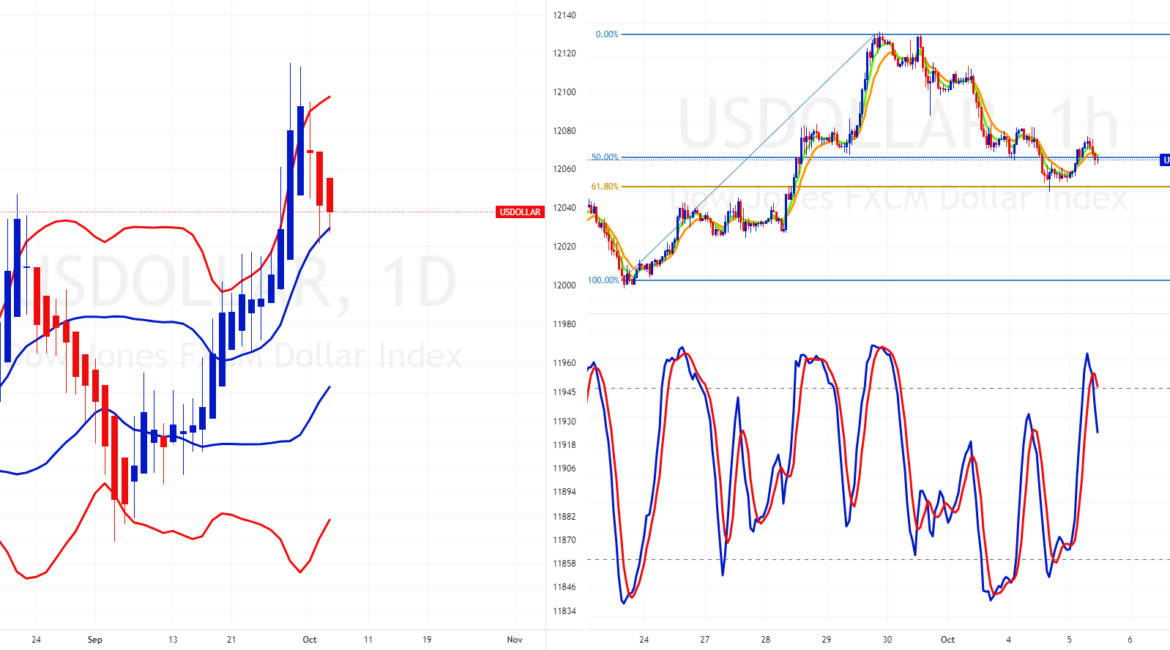
The chart on the left shows FXCM’s USDOLLAR basket on a daily timeframe . It is in the bullish area between the upper red and upper blue bands. The chart on the right shows its hourly time frame. The greenback has pulled back to the 50%/61.8% Fib levels. If these levels hold as support and if the EMAs and the stochastic cross bullishly, the short-term participants may be be syncing up with the long-term chart. If this happens, a movement by the stochastic to the 80 level and the maintenance thereof may be suggestive of an underlying momentum push.


