
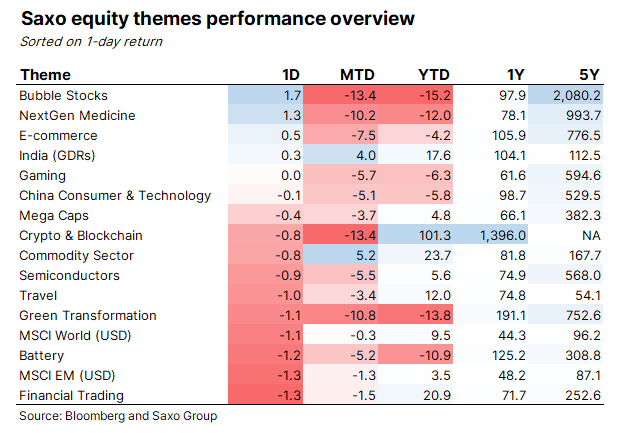
Risk came back in many speculative equity pockets yesterday on a higher volume than the average volume from the day before yesterday suggesting investors are still in favour of buying dips in technology stocks. However, there was one outlier yesterday, and that was green transformation stocks which were down 1.1% underscoring that investors are getting second thoughts on equity valuations on green transformation.
The chart below shows the S&P Global Clean Energy Net Total Return Index as a ratio of the MSCI World Energy Sector Net Total Return Index. What we see is that global clean energy companies had strong relative outperformance back in the years 2004-2007 when solar and wind turbine makers were a hot commodity that investors chased. This was the first wave of speculation in green energy. At the time the political compass was distorted, and the negative consequences of climate change was not consensus yet, and then the Great Financial Crisis hit the world economy and the world’s priorities shifted away from clean energy to that of saving the financial industry and subsequently the Euro. Funding dried up for clean energy companies that were mostly not profitable.
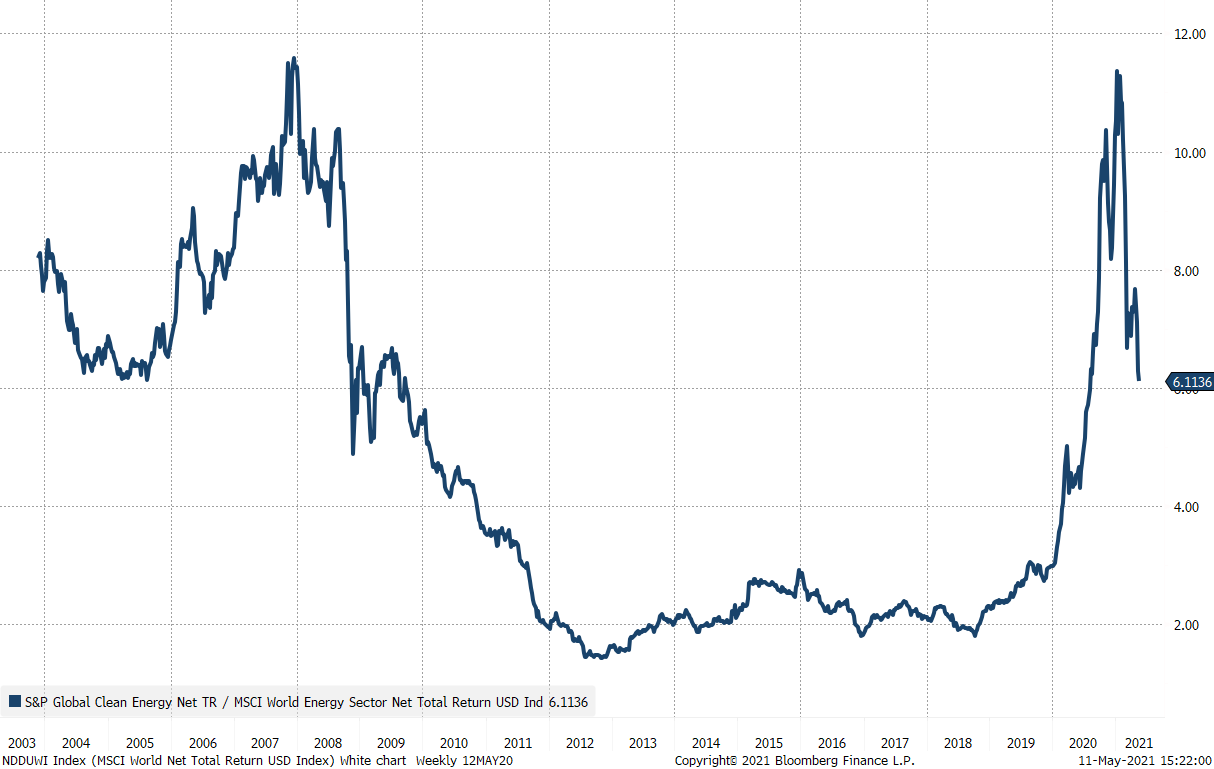
Starting in early 2019 the second wave of clean energy started, the potential classification of a second wave in 2013-2015 was more driven by the oil decline than speculation on green energy itself, with governments changing their policy goals on carbon reductions as consensus among the population had shifted massively in favour of acting on climate change. Over the subsequent two years an increasing number of elections in Europe were decided on climate change issues over immigration and more governments were announcing aggressive carbon emission reduction targets driven by support for electric vehicles. Investors were starting to bet heavily on green transformation companies.
In 2020, the pandemic hit, and a tsunami of retail investors joined the equity market all engaging mostly in technology and ESG (with an emphasis on the E) investments. This combined with huge uptake in green bonds in Europe, rising carbon emission prices, more aggressive targets on carbon emission reductions from China combined with the later Biden victory in the US election fueled a stunning speculative fever.
However, in 2021, fears of rising inflation and interest rates are causing investors to re-evaluate their green transformation exposure. For one thing, higher commodity prices mean that it is more expensive to manufacture wind turbines and other type of green technologies lowering the competitive advantage in the short-term. These companies also heavily depend on access to capital and cheap financing because their investments require a lot of debt financing. A higher interest rate would increase the cost of debt and the discount rate on future cash flows. Sentiment has for now changed so much that global clean companies are down 45% relative to oil and gas majors.
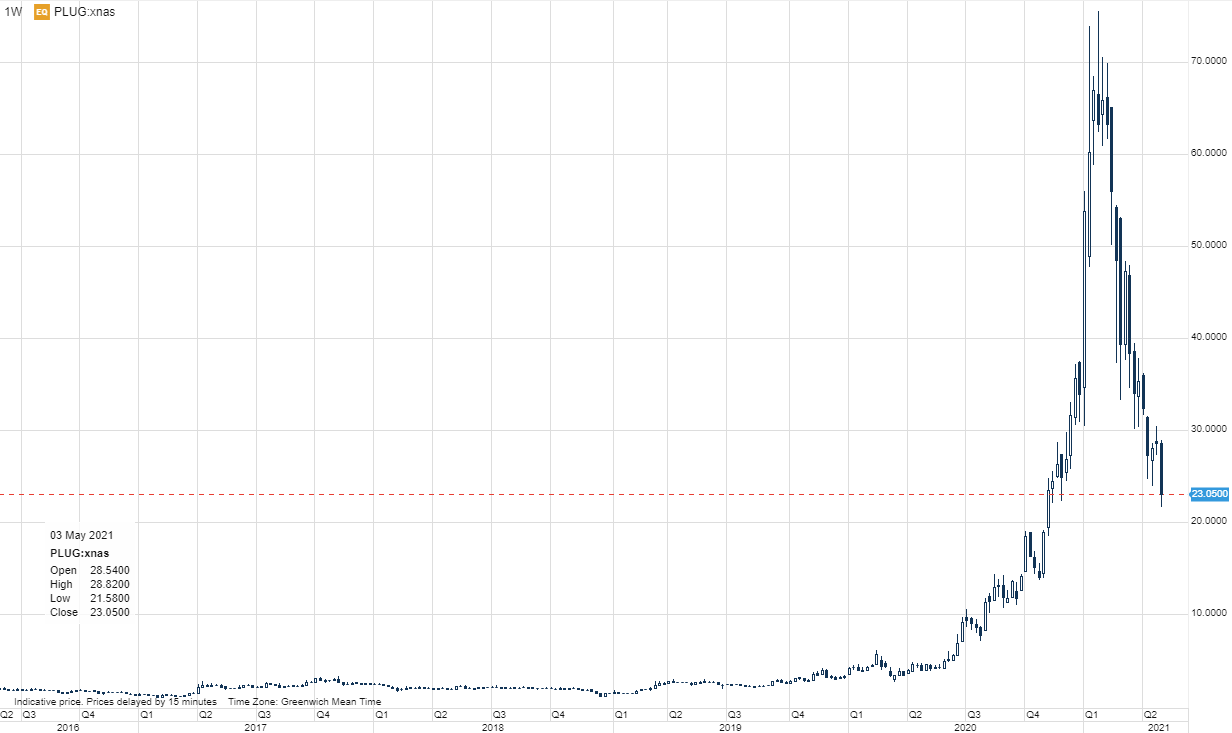
The speculative fever was not seen more rampant than in Plug Power which rose 2,805% from early 2020 to the peak in January 2021. However, results could not deliver on expectations and the company turned out to have certain accounting errors have since fallen 70% from the peak. It is a stark reminder of the volatility in green technology. Our view is that the green transformation is still in its infancy, something like where the computer industry was in 1995 with the launch of Windows 95 and the humble beginning of the Internet, and that the next three decades will see blistering growth rates for this industry. Investors should in our view be exposed to this theme, but investors must diversify across many names as it is too early to predict the big winners.
Most climate conscience people believe that by buying green transformation companies they make the world better, but in fact it is a zero-sum game, because they are buying the shares of someone that is existing their green exposure. The real game changer has been in rising equity valuation on green companies because it sends a price signal to venture capital and private equity firms that by investing in green technology a highly valued IPO is a potentially a lucrative end destination.
The table below shows our green transformation basket which is our take on how to best get exposure to the green transformation.
| Name | Technology | Mkt Cap (USD mn.) | Sales growth (%) | EPS growth (%) | Diff to PT (%) | 5yr return |
| Panasonic Corp | Battery & energy storage | 27,429 | -10.6 | -25.6 | 27.7 | 49.0 |
| Ganfeng Lithium Co Ltd | Battery & energy storage | 21,044 | 18.9 | 3.3 | 21.7 | 368.5 |
| Albemarle Corp | Battery & energy storage | 18,734 | -7.9 | -24.4 | 1.7 | 127.4 |
| Alfen Beheer BV | Battery & energy storage | 1,531 | 32.1 | 91.6 | 25.0 | NA |
| Carbios | Bioplastic | 390 | 13.3 | -45.0 | 23.5 | 254.8 |
| Avantium N.V. | Bioplastic | 183 | -28.6 | 3.9 | 75.9 | NA |
| Good Natured Products Inc (*) | Bioplastic | 194 | 65.5 | -57.6 | 74.5 | 665.5 |
| Symphony Environmental Technologies PLC | Bioplastic | 46 | 18.7 | 46.4 | NM | 221.7 |
| Aker Carbon Capture AS (*) | Carbon capture | 1,007 | NA | NA | 48.5 | NA |
| Tesla Inc | Electric vehicles | 594,568 | 38.1 | 2617.1 | -0.1 | 1,386.4 |
| NIO Inc | Electric vehicles | 57,135 | 202.3 | 37.9 | 66.6 | NA |
| XPeng Inc | Electric vehicles | 20,005 | 151.8 | NA | 102.5 | NA |
| Zaptec AS/Norway | Electric vehicles | 379 | 40.4 | NA | 86.4 | NA |
| Blink Charging Co | Electric vehicles | 1,303 | 125.8 | -60.6 | 60.1 | 55.4 |
| Waste Management Inc | Environmental services | 59,604 | 0.7 | -4.8 | 0.5 | 155.1 |
| Veolia Environnement SA | Environmental services | 17,890 | -4.3 | -50.1 | 19.2 | 53.1 |
| TOMRA Systems ASA | Environmental services | 7,016 | 3.8 | 36.0 | -3.1 | 366.7 |
| Cleanaway Waste Management Ltd | Environmental services | 4,470 | -1.1 | 42.0 | -5.6 | 305.6 |
| Plug Power Inc | Fuel cells & hydrogen | 11,859 | 55.0 | -292.5 | 125.3 | 1,218.4 |
| Ballard Power Systems Inc | Fuel cells & hydrogen | 4,374 | -14.2 | -35.1 | 64.6 | 997.0 |
| Bloom Energy Corp (*) | Fuel cells & hydrogen | 3,577 | 19.0 | 67.8 | 58.1 | NA |
| NEL ASA (*) | Fuel cells & hydrogen | 2,989 | 12.0 | NA | 65.0 | 362.1 |
| ITM Power PLC | Fuel cells & hydrogen | 2,755 | -82.3 | -37.2 | 100.8 | 2,325.6 |
| Ceres Power Holdings PLC | Fuel cells & hydrogen | 2,704 | 23.5 | -33.4 | 78.2 | 1,016.3 |
| China Yangtze Power Co Ltd | Hydro | 69,811 | 17.4 | 18.0 | 22.6 | 92.4 |
| Verbund AG | Hydro | 30,181 | -35.4 | 27.7 | -22.0 | 554.6 |
| Brookfield Renewable Partners LP | Hydro | 16,865 | 2.5 | -182.8 | 20.9 | 195.8 |
| Meridian Energy Ltd | Hydro | 9,916 | -2.4 | -56.1 | 3.0 | 173.8 |
| Enphase Energy Inc | Solar | 16,477 | 19.3 | 41.3 | 61.4 | 6,759.9 |
| Xinyi Solar Holdings Ltd | Solar | 12,389 | 35.4 | 82.9 | 54.2 | 335.7 |
| Sunrun Inc | Solar | 8,757 | 19.6 | NA | 84.4 | 549.6 |
| SolarEdge Technologies Inc | Solar | 11,328 | -9.6 | -35.5 | 35.2 | 1,144.7 |
| First Solar Inc | Solar | 7,643 | -2.6 | 32.7 | 21.4 | 48.0 |
| Scatec ASA | Solar | 3,973 | 42.2 | NA | 34.8 | 477.5 |
| Orsted AS | Wind | 59,872 | -27.2 | -86.3 | 22.8 | 307.5 |
| Vestas Wind Systems A/S | Wind | 38,248 | 15.0 | -24.4 | 1.5 | 178.0 |
| Siemens Gamesa Renewable Energy SA | Wind | 21,727 | 1.3 | NA | 22.0 | 81.1 |
| China Longyuan Power Group Corp Ltd | Wind | 10,493 | 4.1 | 18.6 | 35.8 | 115.6 |
| Northland Power Inc | Wind | 7,186 | 24.2 | 20.4 | 37.7 | 113.0 |
| Boralex Inc | Wind | 3,011 | 6.5 | 17.0 | 43.1 | 131.2 |
| Aggregate / median values | 1,189,062 | 13.3 | 3.3 | 35.2 | 305.6 |
Source: Bloomberg and Saxo Group
* Peter Garnry has personal holdings in these companies


